Interactive Dashboard
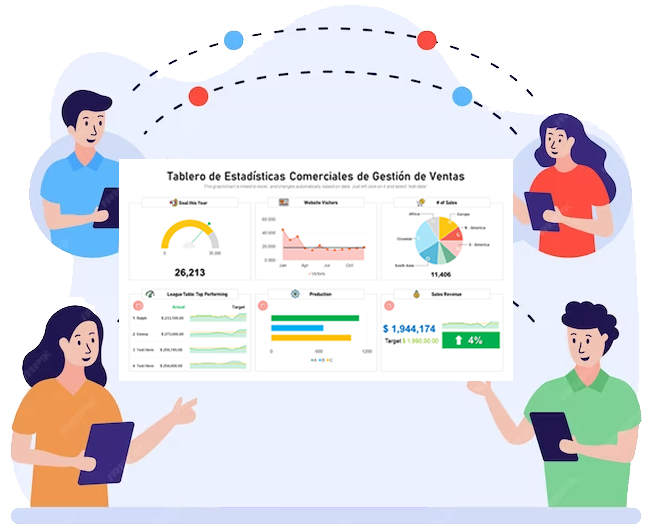
Explore interactive dashboards that transform your data into valuable insights. Click on the lower right corner of the sales simulation example below to interact and experience the power of visual analysis. To exit, press the Esc key.
What is Business Intelligence?
Business Intelligence (BI) is the set of tools and processes that analyze your business data to turn it into actionable strategies, empowering every area of your organization to make informed decisions. Also known as a Decision Support System (DSS), the BI system processes current and historical data, presenting the results in dynamic visual reports such as dashboards, charts, and maps that are easy to share.
With Vtiger BI, you save time by gathering, organizing, and analyzing your data, anticipating issues, mitigating risks, identifying opportunities, and making swift, effective decisions that strengthen your business.
BENEFITS
Advanced KPIs Charts
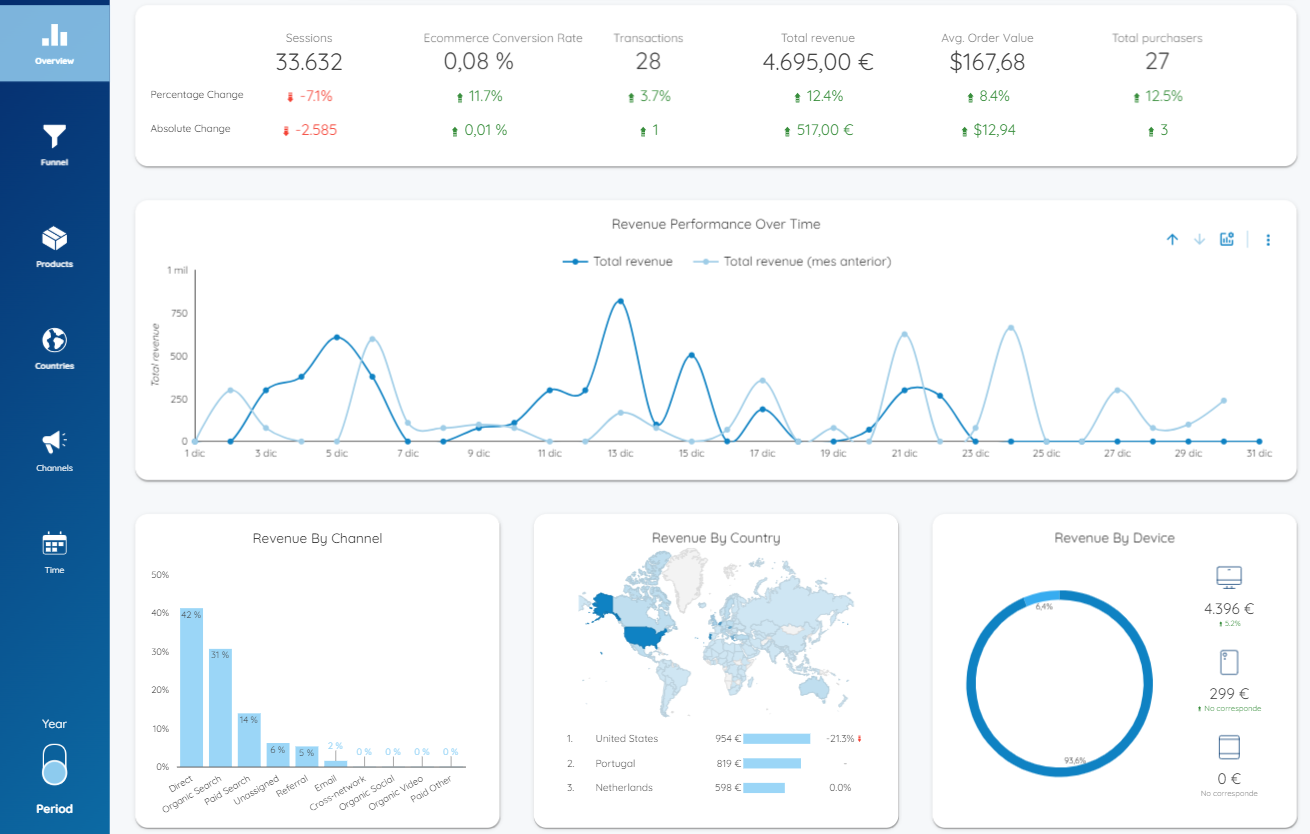
Track your KPIs with line, bar, pie, geographic maps, bubble charts, tables, and much more.
Personalized Interactivity
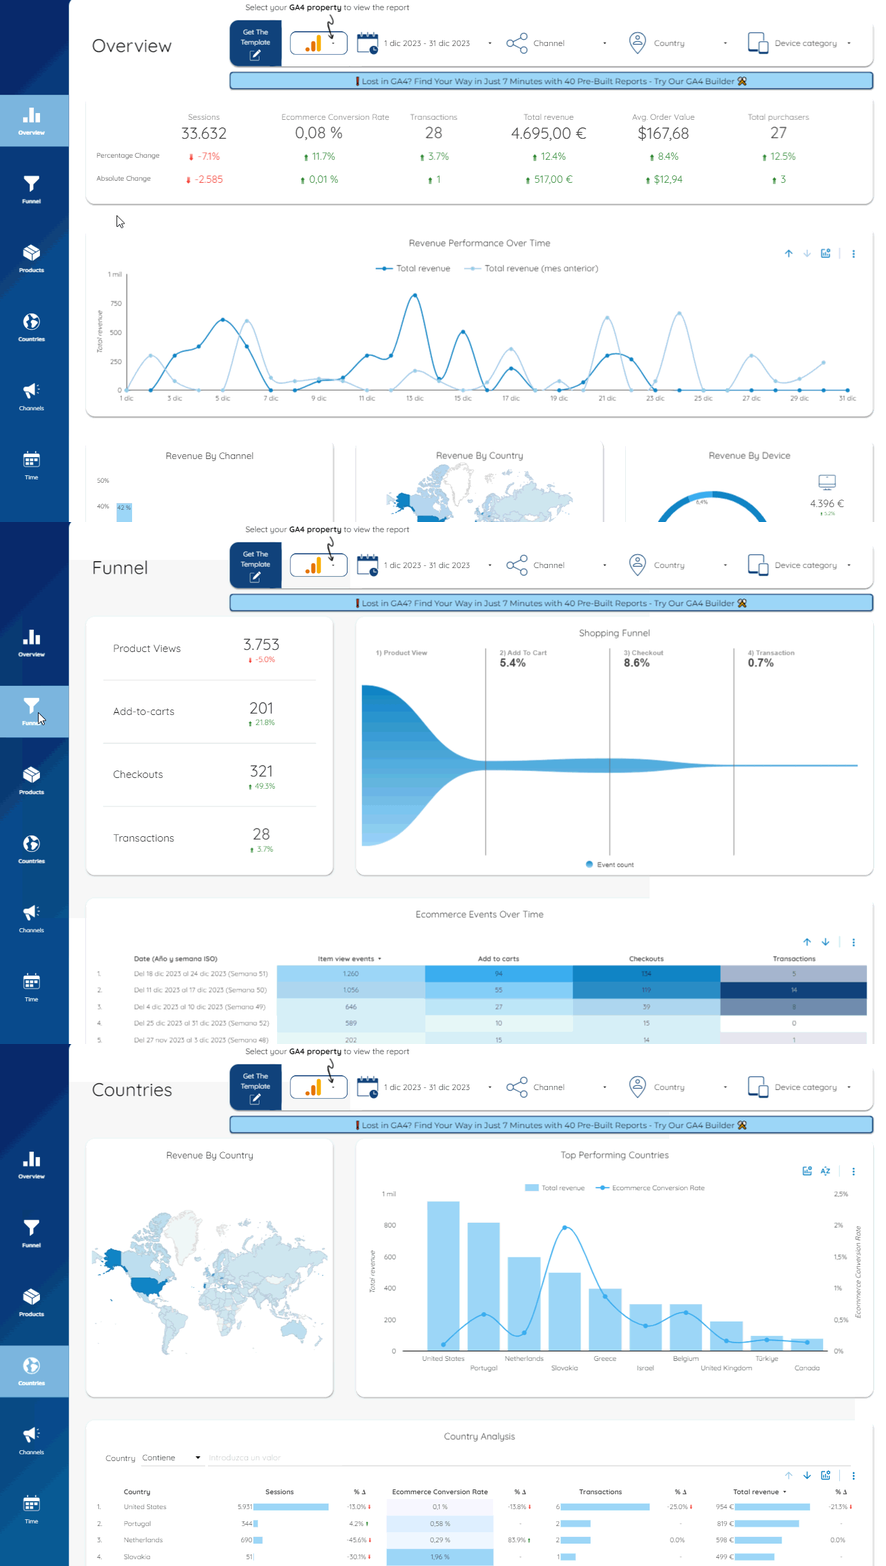
Customize reports with filters, period controls, and flexible options so that every team member can see the data they need.
Multiple Data Sources
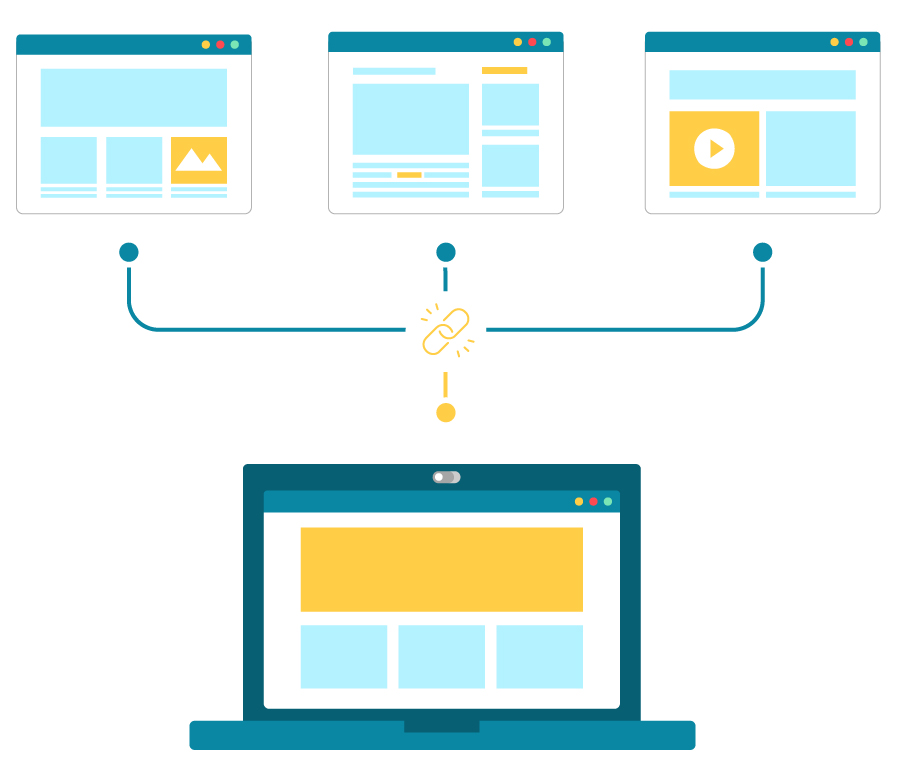
Integrate data from Vtiger CRM along with other sources to achieve a comprehensive view in one place.
One-Click Executive Reports
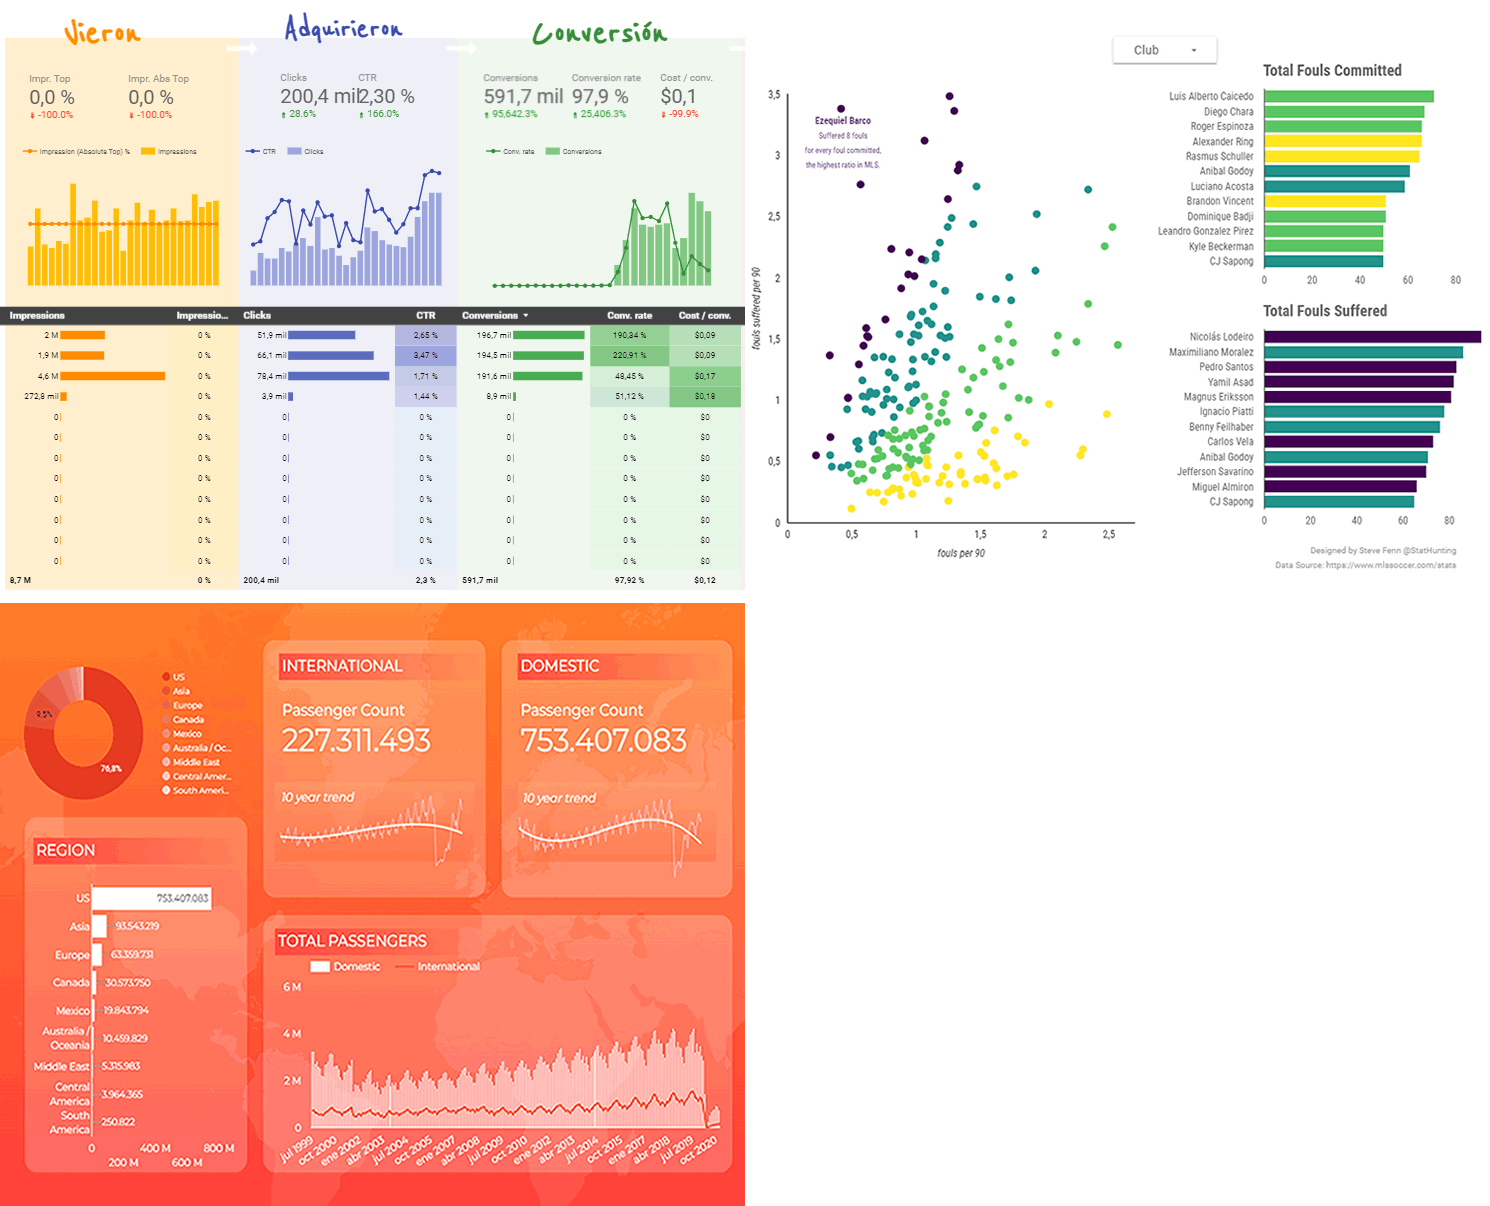
We design specialized reports that deliver real-time key information, giving decision-makers easy access to essential data.
Complete Business Visibility
Monitor all areas of your business—sales, customer service, operations, and more—on one platform.
Simple and Effective Implementation
We follow a simple yet highly effective methodology:
- Exploration Session: We meet with you to understand what you want to measure, and if you’re unsure, we offer strategic suggestions.
- Data Connection and Dashboard Creation: We connect to your Vtiger CRM and design dashboards with the charts, KPIs, tables, and everything your business needs.
- Review and Adjustments: We present the work for your feedback, making any necessary adjustments to ensure optimal results.
With Vtiger BI, we simplify business intelligence so you can make informed, quick, and strategic decisions.

